I build data systems teams can trust.
I'm an analytics engineer who organizes a team's information, builds the pipelines, and turns insights into results. I design for semantics, intuition, and practicality, so a team can do their best work.
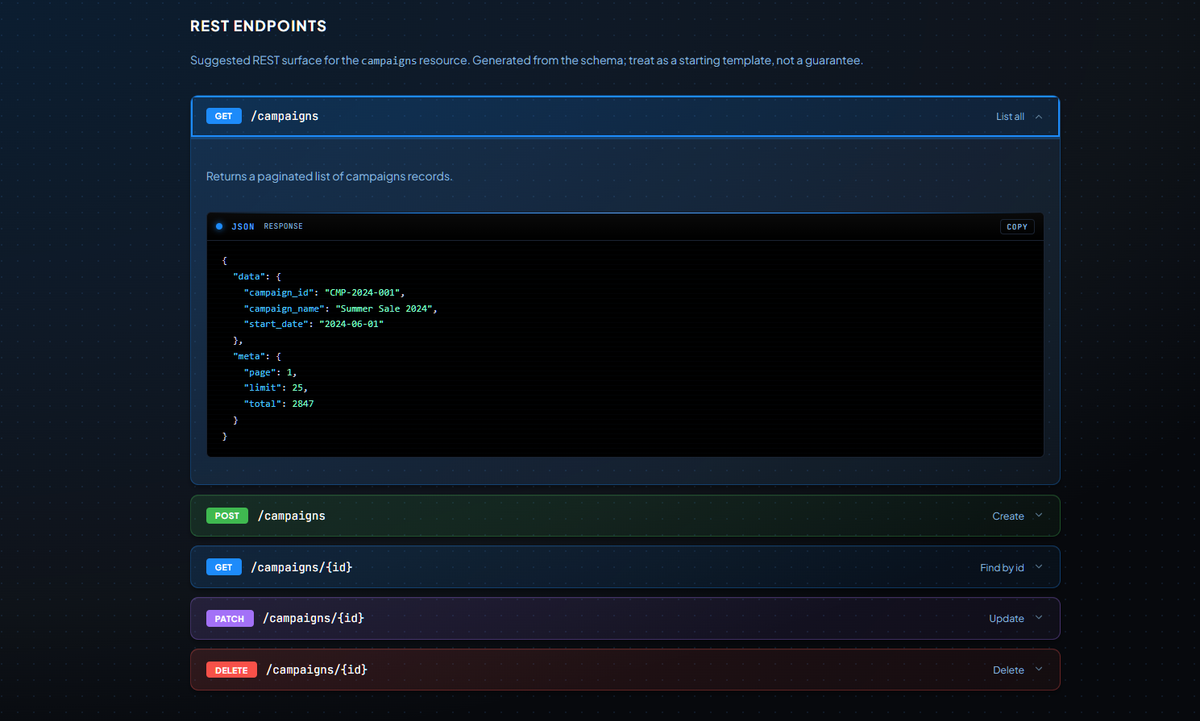
Data Documentation
Same shape on every page, so a new dev finds the endpoint they need without spelunking the codebase. The docs do the teaching, not someone else's calendar.
How it helps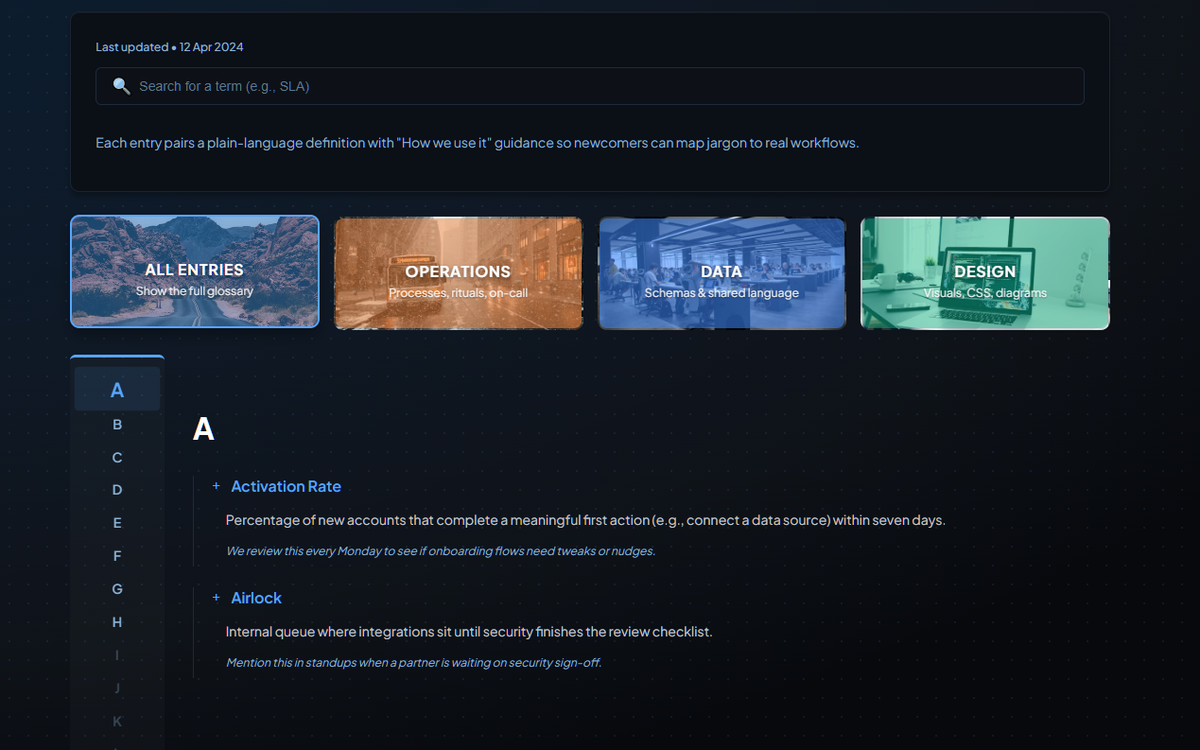
Internal Glossary
One definition per term, owned and dated. The recurring "wait, what do we mean by X" debate dies, and onboarding cuts a handful of repeat questions in week one.
How it helps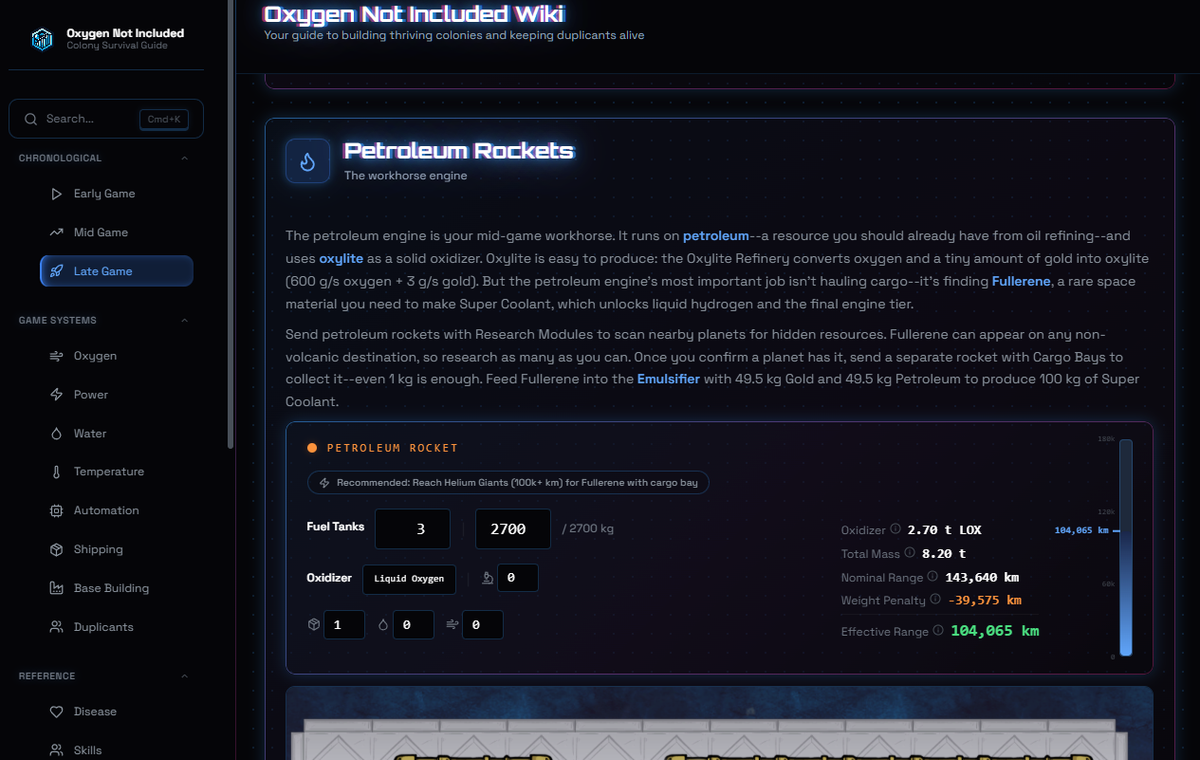
Wikis
Most personal wikis collapse under their own growth. This one's built so the structure absorbs new pages instead of buckling around them. The same approach scales to any team's knowledge base.
How it helps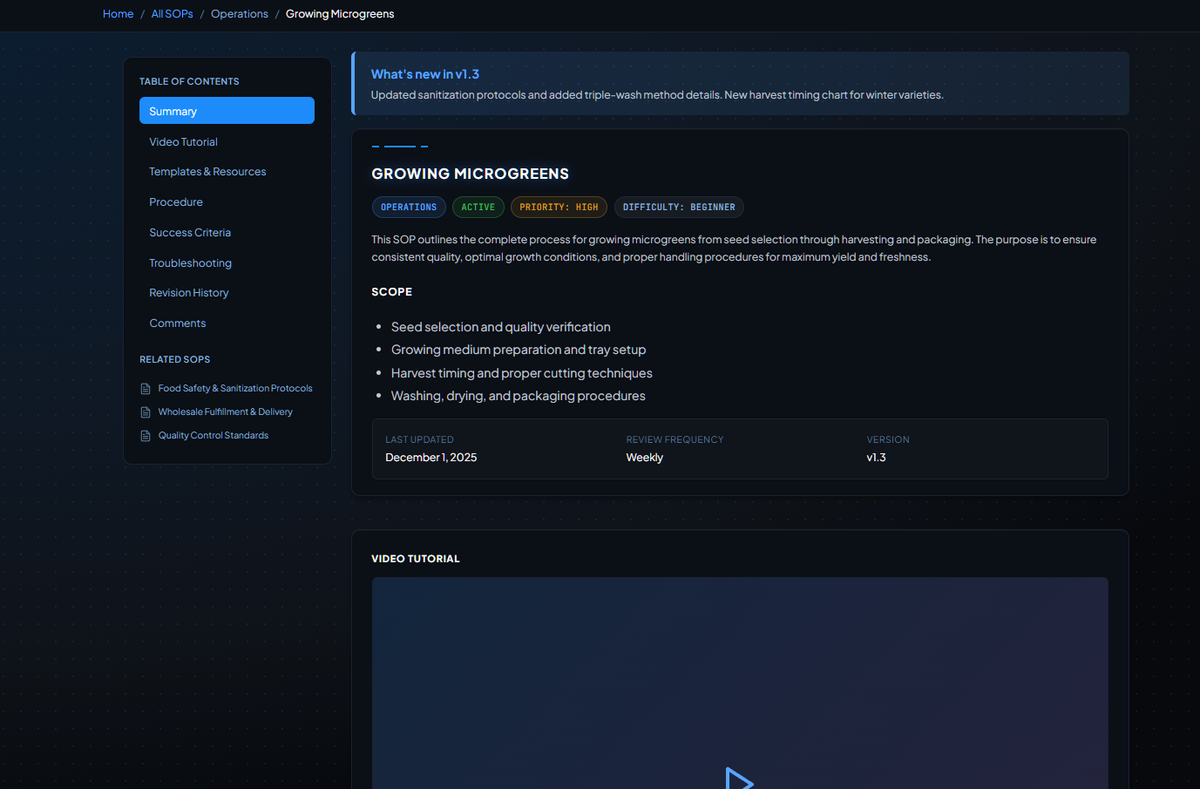
SOPs
Same shape every procedure: synopsis, scope, steps, version. A new hire runs the operation the same way the senior does, from the document.
How it helps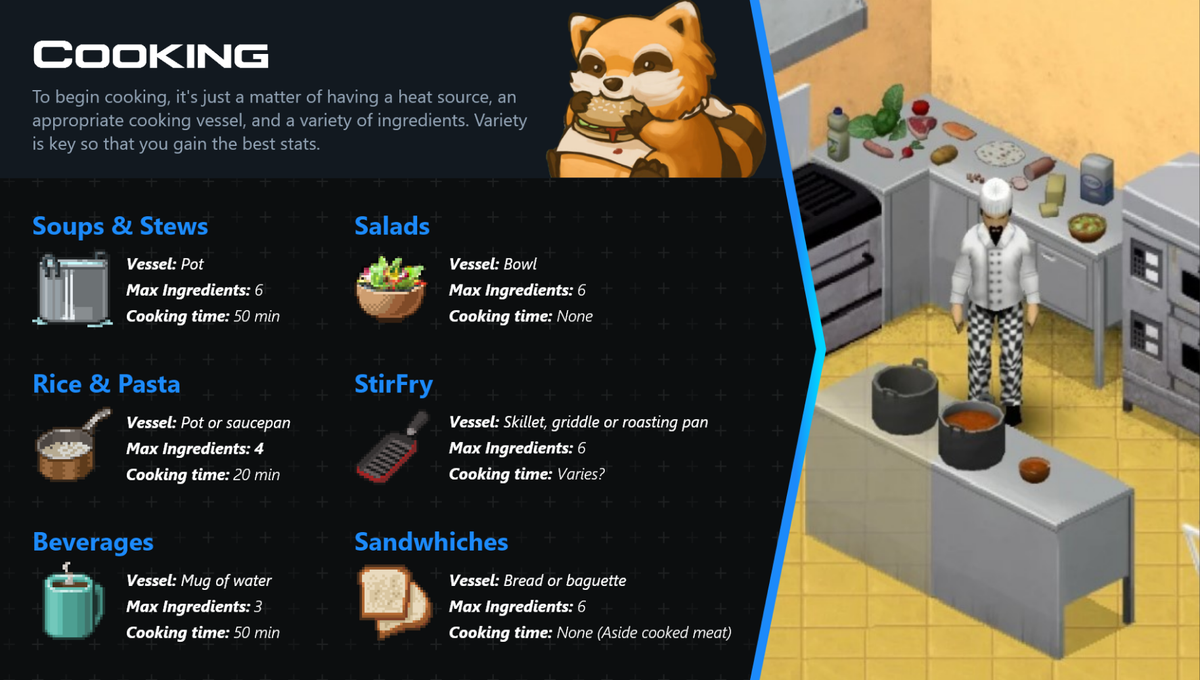
Presentation
Decks that teach instead of recap. The audience walks away with a way of seeing the thing, not a list of bullet points they'll forget five minutes later.
How it helps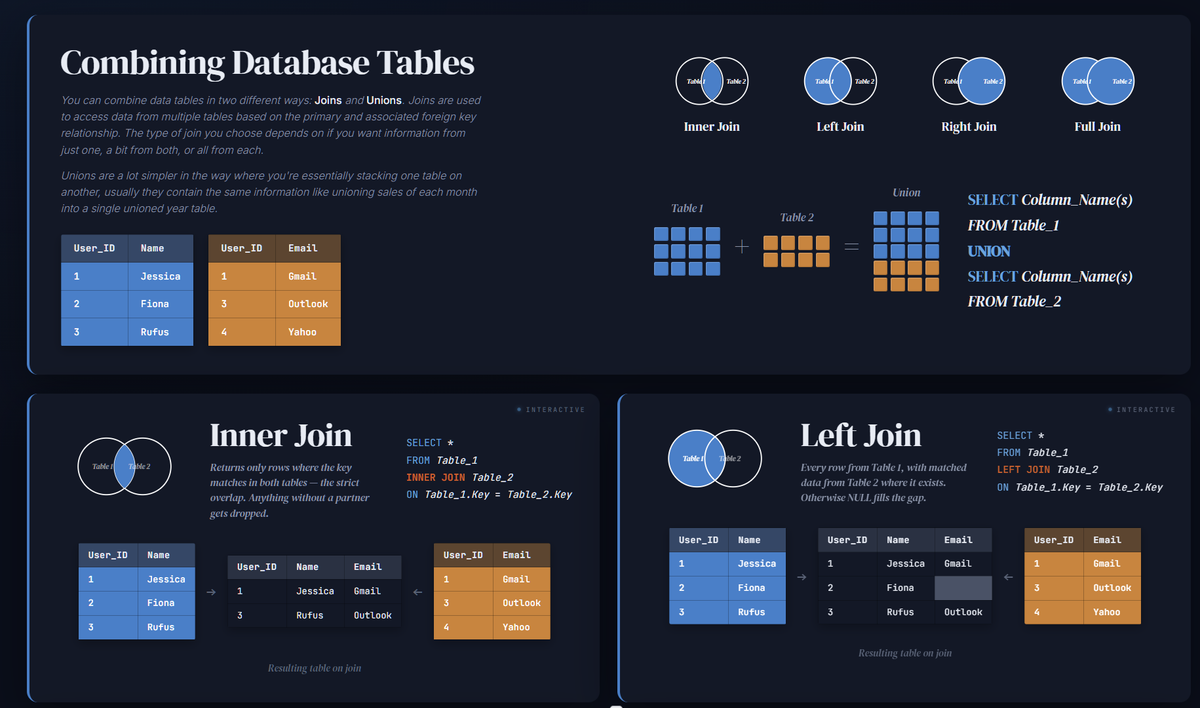
Infographics
What a long doc takes pages to explain, an infographic shows at a glance. Compresses a system, process, or decision into something a reader gets first and references later.
How it helps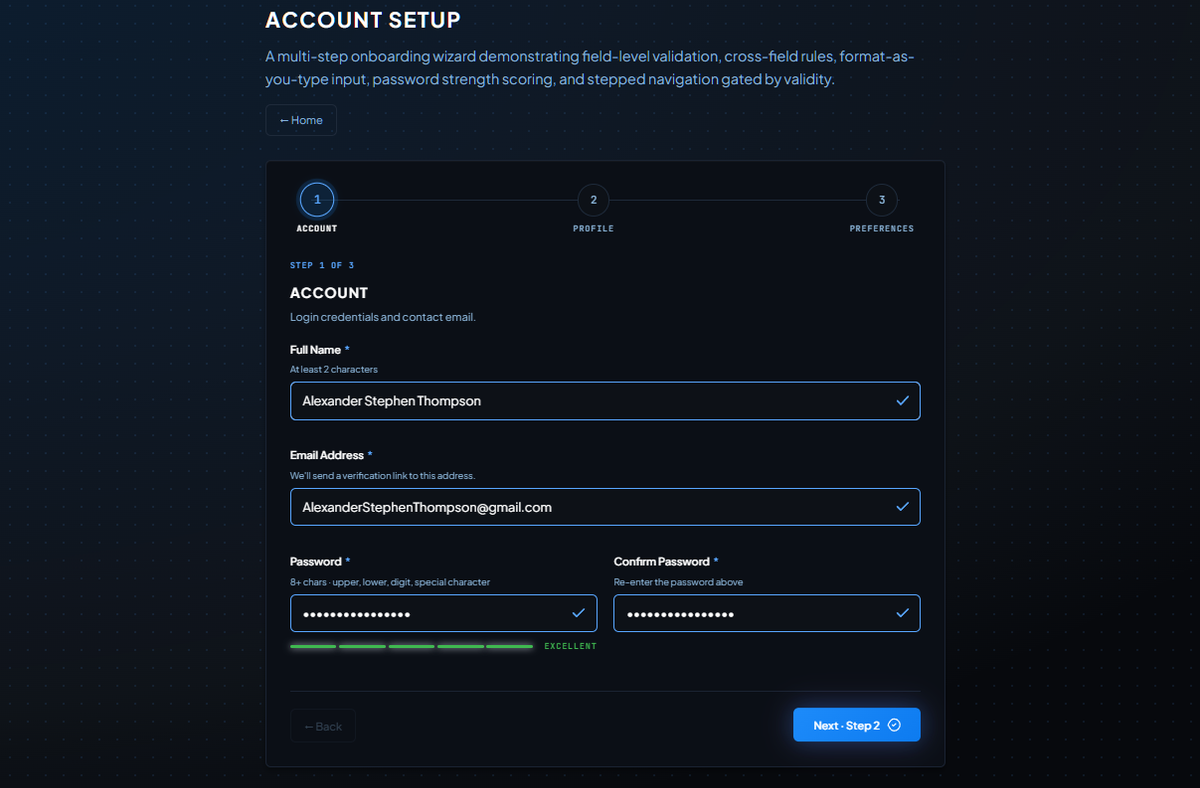
Data Validation
Validation on both sides of the wire: instant feedback on the client, source-of-truth rules on the server. Every value that lands downstream is standardized, reliable, and safe to act on.
How it helps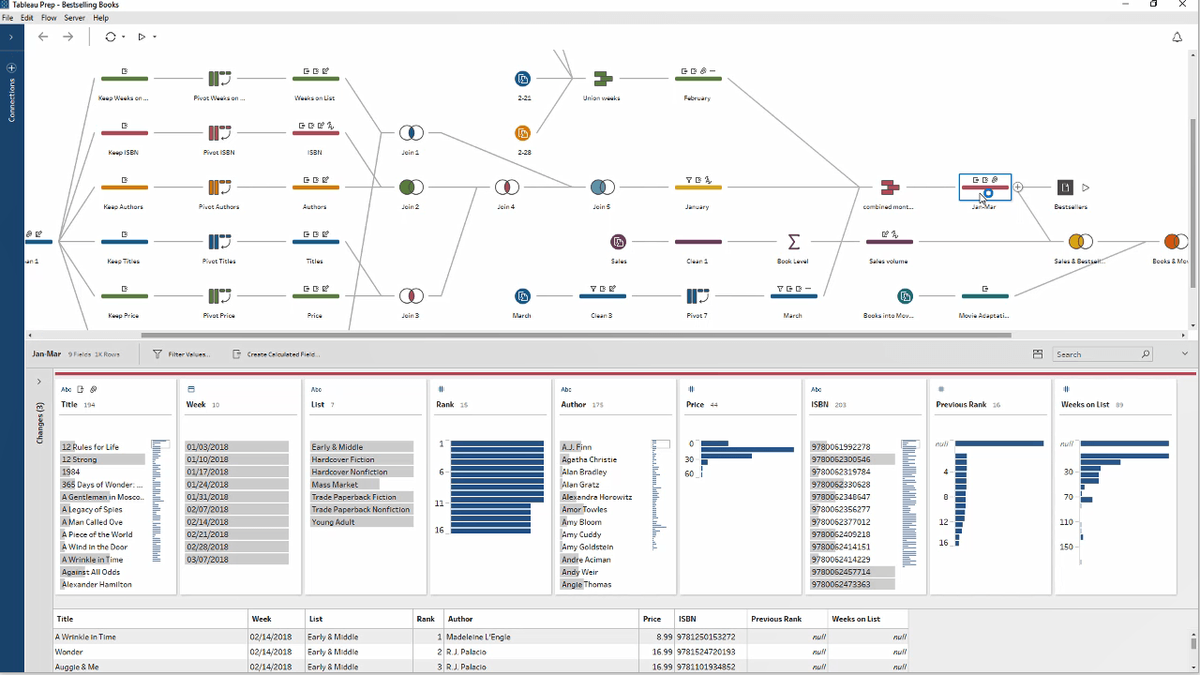
Tableau Prep
Pick up the flow cold, change one cleaning node, run it. Nothing downstream breaks. Visual flows that turn messy source files into analysis-ready datasets without burying the steps.
How it helps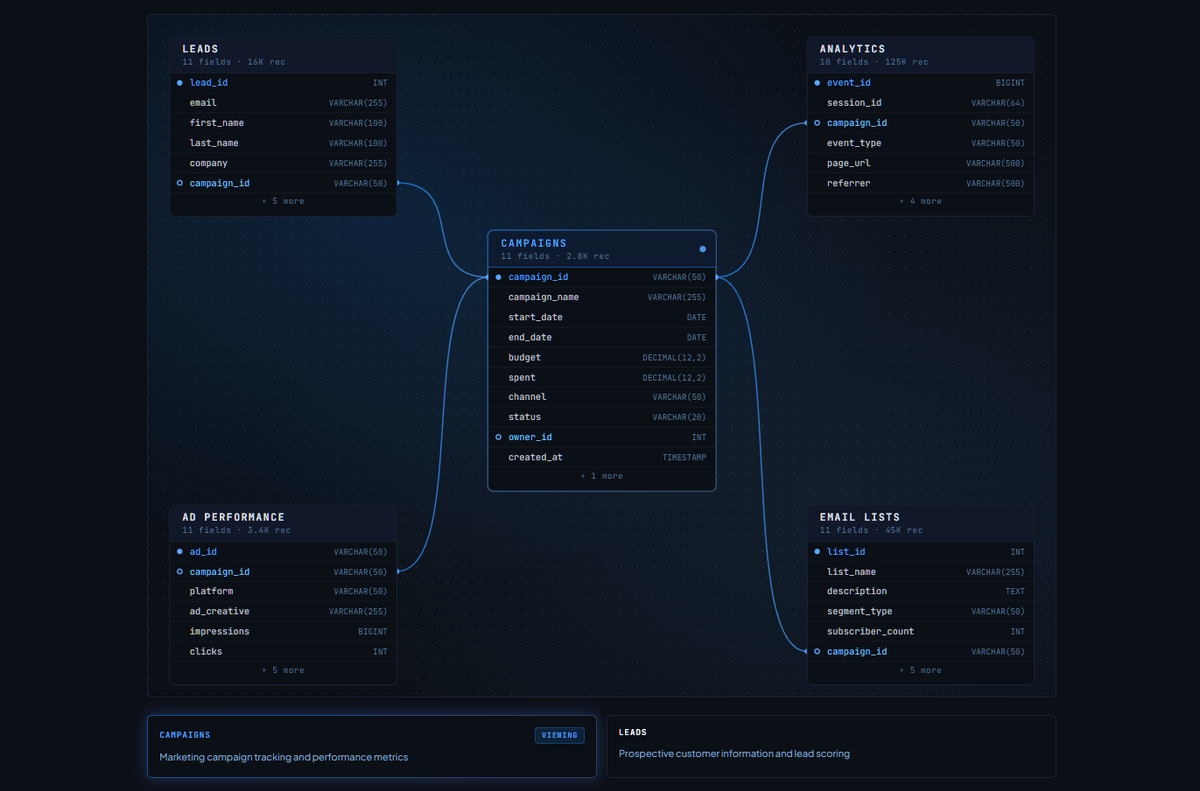
Clean Modeling
A new engineer is functional in minutes, not from reading CREATE TABLEs, but from a color-coded diagram that shows how the database fits together.
How it helps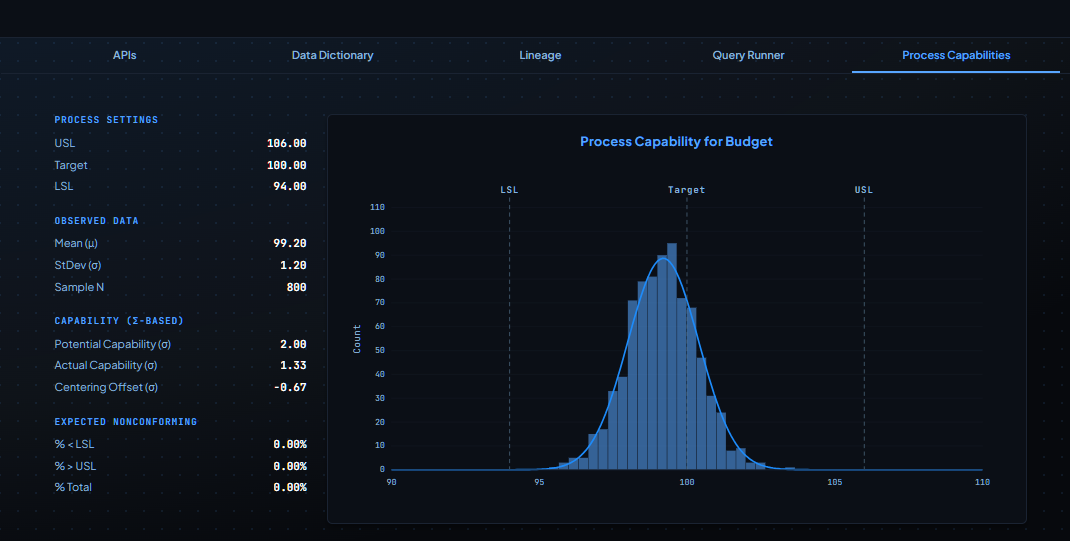
Process Capability
An average can hide a process that misses spec a third of the time. Capability analysis catches what the average smooths over.
How it helps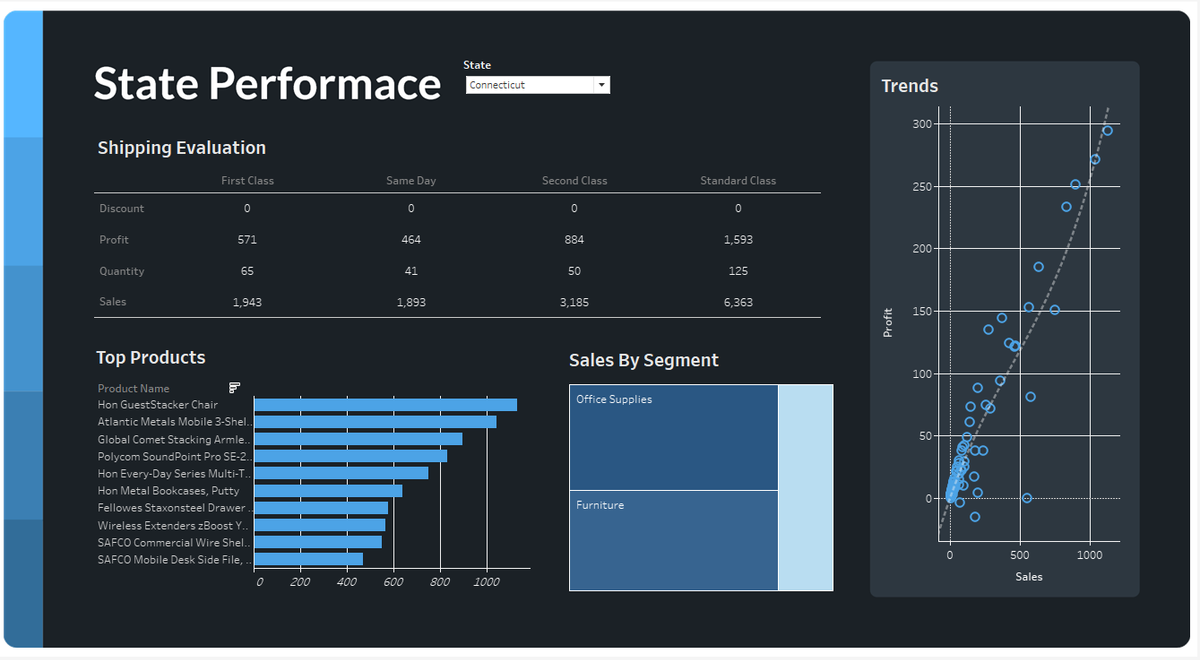
Dashboards
Three clicks from the headline to the cause, no analyst on the call. Built around the question someone was actually asking, not the data the warehouse happened to have.
How it helps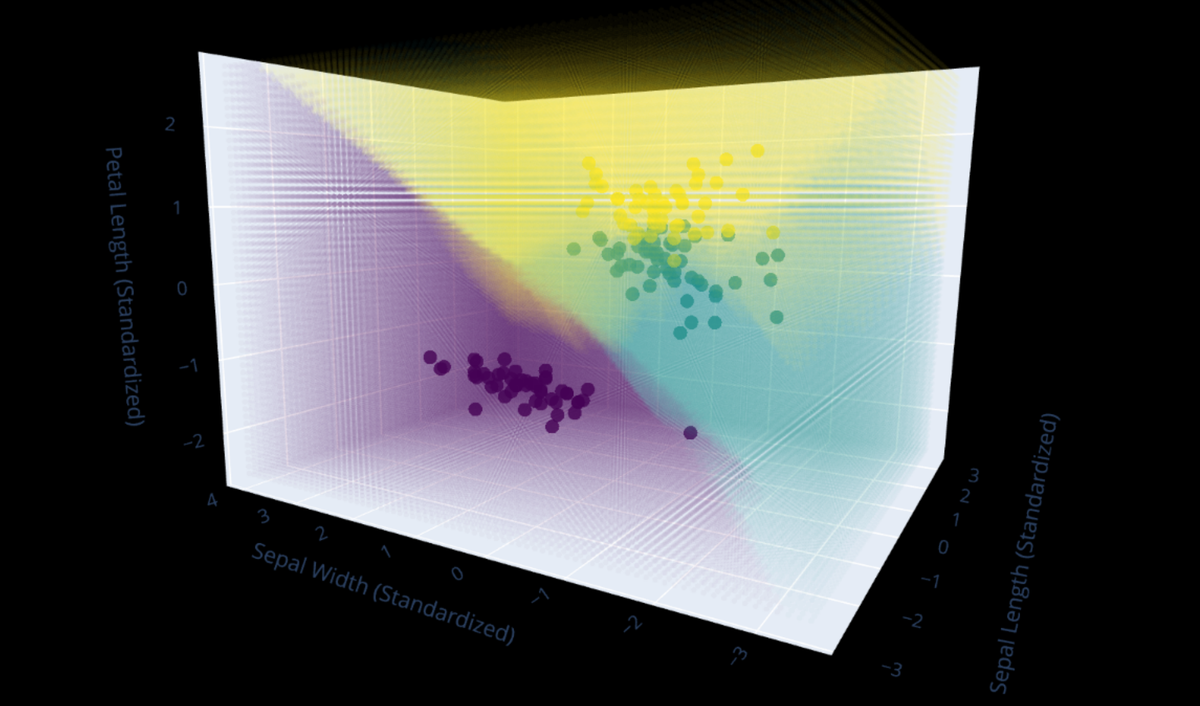
Attribute Prediction
A 3D decision surface you can rotate. The model's behavior becomes inspectable instead of opaque, and stakeholders get something concrete to question.
How it helps
Dynamic Reporting
Errors caught at entry, statuses visible at a glance, the sheet reshapes as the work moves through. The thinking that used to live in someone's head lives in the document instead.
How it helps
Internal tooling
Purpose-built apps for the workflow no SaaS quite covers. The team gets the exact tool the work needs: fast to use, easy to teach, easy to change.
How it helps
Continual Improvement
The moment a process starts misbehaving, the chart pages someone. Hours, not the next standing meeting. The system watches itself.
How it helpsA practitioner across the data lifecycle.
I work at the unique convergence of data, UI/UX, and internal tool development, turning numbers into something people can actually understand, trust, and act on. I build the pipelines, structure the information, surface what matters, and document the systems so the improvements are retained. Clean enough for your team to trust, clear enough for AI to build on.
Relevant Experience
-
Purchasing Agent & Logistics Analyst — TopBuild
Purchasing and logistics for a building-products company, along with the reporting, automation, and data analysis the team relied on day to day to keep orders, suppliers, and availability on track.
-
Information Designer — Bethune-Cookman University
A short contract focused on making the university's business reports and internal documents clearer and easier to use, applying design and information-structure skills to how the team presented its information.
-
Full Stack Web Developer — Confidential Client
Frontend development for a private social platform, owning its user-facing features and overall experience while working closely with the owner across the full stack.
- Snowflake
- dbt
- Tableau
- Excel
- AWS
- Claude
Education
-
Business Administration — Associate's
Developed a strong foundation in management, finance, and organizational strategy, focusing on decision-making, process optimization, and cross-functional business communication.
-
Computer Programming — Associate's
Developed a foundational understanding of object-oriented programming practices, semantic code, and algorithmic processes to solve problems dynamically.
-
Database Technology — Associate's
Developed working knowledge of database design, management, and tuning, the foundation for the BI work I do downstream in tools like Tableau and Excel.
-
Information Technology — Bachelor's
Building working knowledge of networks, systems administration, and cloud infrastructure, rounding out the operational layer that data pipelines and dashboards depend on to run.
-
 Microsoft Office Master Specialist Microsoft
 -
 Tableau Data Analyst Tableau
 -
 Six Sigma Green Belt ASQ Certified
 -
 AWS Data Engineer Amazon Web Services In progress
 -
 SnowPro Core Snowflake Planned
Get in Touch.
Email's the fastest way to start something — a role, a project, a question. MyAvidAnalytics@gmail.com. Avid Analytics builds the clean systems your business runs on: intuitive enough for the team to want to use, structured enough for AI to act on. The platforms below are where the rest of the work lives.